 Proteside
 Dashboard
Read the store's indicators, the activity chart and the payment, script and alert summaries.
The Dashboard is the first screen after you sign in. It summarizes the protection of the selected store: how many pages the SDK monitors, the state of the script inventory, which alerts are open and whether the payment methods are intact.
The Dashboard only shows data. To act on a script or an alert, follow the View all shortcuts.
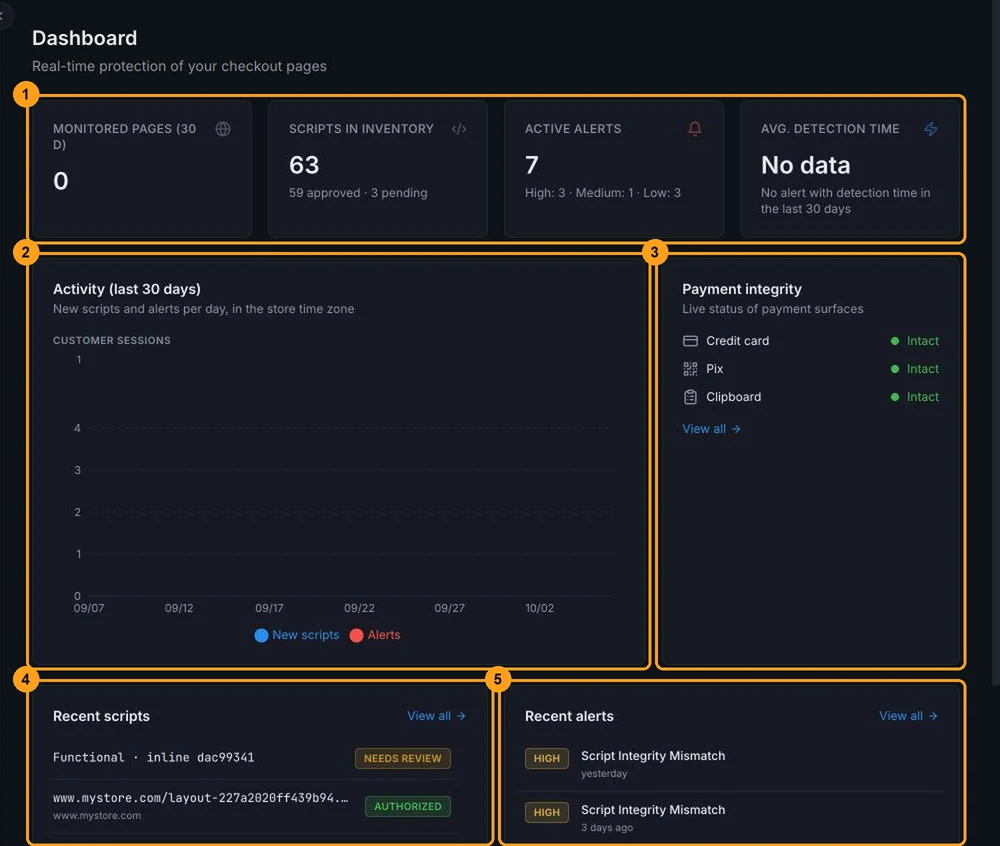
Indicators
The four indicators (1) are at the top:
| Indicator | What it counts |
|---|---|
| Monitored pages (30 d) | Distinct checkout pages where the SDK ran in the last 30 days, with real customer visits. Addresses on different domains count separately: checkout.mystore.com/ and www.mystore.com/ are two pages. Proteside's automated checks aren't counted. |
| Scripts in inventory | Every script the SDK has seen in the store, in any status. The line below shows how many are approved and how many are pending. |
| Active alerts | Open alerts, broken down by severity (Critical, High, Medium, Low). The card gets a red outline when there's a critical alert. |
| Avg. detection time | Average time, in milliseconds, the SDK took to detect the threats in alerts from the last 30 days. Shows No data when no alert in the period has this measurement. |
The numbers may not match the menu
- Pending, on the scripts card, counts only Needs review scripts. The number next to Scripts in the sidebar also adds the Suspicious ones.
- Active alerts includes snoozed alerts, which are still open. To see only the ones that need action, use the Open tab in Alerts.
During a trial without a confirmed subscription, a banner with the days remaining and the Upgrade button appears above the chart. The button takes you to Billing.
Activity for the last 30 days
The Activity (last 30 days) chart (2) has two parts, each with its own scale:
- At the top, the green Customer sessions bars show how many times per day customers opened pages with the SDK.
- Below, the areas show, per day, the New scripts (in blue), seen for the first time that day, and the Alerts (in red), created that day.
Days follow the store's time zone, set in Store. Hover over the chart to see the values for a day.
How to read it:
- Green bars disappearing from one day to the next: the checkout may have lost the snippet. Check SDK Health.
- Spike in new scripts: someone published a change to the site or a vendor changed its files. Review the new scripts in Scripts.
- Spike in alerts with no known change to the site: investigate in Alerts first.
Payment integrity
The Payment integrity panel (3) shows the state of each monitored payment method, such as Credit card, Pix and Clipboard:
| Status | Meaning |
|---|---|
| Intact | The SDK checked a recent payment with this method and there's no open tampering alert. Clipboard becomes intact as soon as the SDK is active. |
| Tampered | There's an open tampering alert for this method. Open the details immediately. The status goes back to normal when you resolve the alert. |
| Waiting | The SDK is active, but hasn't checked any payment with this method yet. |
| Not configured | The store hasn't received any event from the SDK yet. |
View all opens Payment integrity. You choose the monitored methods in Payment protection.
Recent scripts
Recent scripts (4) lists the five scripts seen most recently on the checkout, with the domain and the status. They aren't necessarily new scripts: an old script that loads on every visit shows up here.
Click a script to see its details. From here the details are read-only: to authorize or block, click View all and open the script in Scripts.
Blocked shows in green on the Dashboard
In this panel, Blocked scripts get the same green badge as Authorized ones. Read the badge text, not the color. In Scripts, Blocked shows in gray.
Recent alerts
Recent alerts (5) shows up to five open alerts that happened in the last 7 days, from newest to oldest, with the severity and how long ago they were seen. Click an alert to open it in Alerts. View all opens the full list.
Store with no data
Right after installation, the Dashboard shows zeros. Recent scripts says "No scripts detected yet. Install the SDK to start monitoring." and Recent alerts says "No active alerts — your checkout is clean.". Open the store's checkout in your browser and reload the Dashboard. If it's still empty, follow Verify the installation.